Recent News
High school students take a dive into data science
July 30, 2018
How has the number of movies changed over time? Which countries have produced the most feature films? Which directors’ movies are highest ranked? And who makes the longest and shortest films? There’s no shortage of this kind of information at the Internet Movie Database (IMDb), which stores information on nearly 500,000 feature films from all over the world. The challenge for 18 high school students attending the University of Rochester’s summer precollege program: How to make sense of it all in a visually compelling, easily understood fashion.
Thanks to a weeklong course in data science, most of them succeeded in doing just that – using Tableau to create brightly colored bubble maps, scatter plots, and dashboards.
As they presented their work at the end of the week, it was clear that they had taken to heart one of several themes of the class, taught by Ajay Anand, deputy director of the Goergen Institute for Data Science, and Arpit Varma, a master’s student in the Technical Entrepreneurship and Management Program:
“Data visualization is not a personal preference, to be done ‘just in case some people are more visual.’ It is a necessity! Some insights can only be found through visualization.”
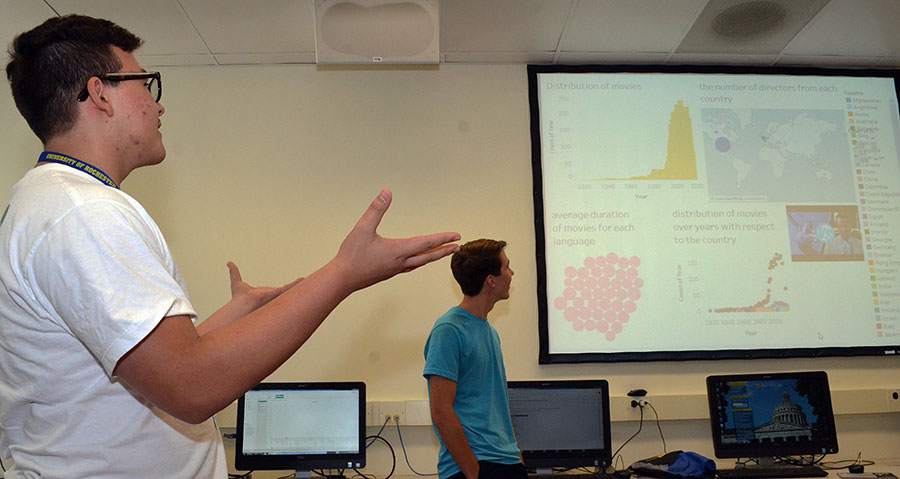
Ignacio Torres, a rising senior from Boca Raton, FL, and his teammate, Billy Rayfield of Chesterfield, MO, explain their dashboard showing movie trends based on information from the Internet Movie Database. They participated in a weeklong class on data science offered through the Intensive Studies track of the University of Rochester’s summer precollege program.
Getting the big picture
The University’s summer precollege program includes an Intensive Studies track that enables rising 11th and 12th-grade students to take a deeper look into non-credit college-level material while living on campus for three weeks. The data science class was the first of three courses the students took with an engineering focus. The other two classes were in biomedical engineering and audio and music engineering.
“It’s interesting, I really enjoy it,” Ben Christensen, a rising senior from Rochester, said of the data science class. “I really enjoy math and I wanted to see how I could apply it to something else.”
Nabim Kim, a rising senior from Busan, South Korea, was clearly in her element. She’s considering a major in computer or data science and liked what she was seeing in the class. “The faculty is really good, the program is fun, and there are so many hands-on experiments. I really love it.”
Above all, she said, the class was helping give her “a broader perspective” of what data and computer science are all about.
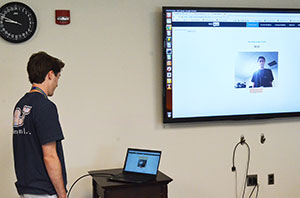
with RocSpeak, a computer program developed by Ehsan
Hoque’s Human-Computer Interaction Lab to provide
coaching in public speaking skills while other
students in the class look on.
That “broader perspective” was the first order of business. By the end of the week, the students would learn how Netflix and Amazon use data science to divine our interests, dive into introductions to machine learning and data visualization, visit the University’s VISTA Collaboratory data visualization lab, attend a tutorial on deep learning with Assistant Professor Chenliang Xu of computer science, and visit the Human-Computer Interaction lab of Assistant Professor Ehsan Hoque.
But first Anand and Varma gave them the big picture.
“You’ve all heard of data science,” Anand says. “It’s all over the news. It’s likely to be mentioned in any kind of technical article, and a lot of the emphasis in companies today is how can we make use of data, so we can make more effective decisions, and be more productive.”
The instructors emphasized that:
- Data science represents the overlap of computer science, math and statistics, and the multiple “domains” or fields that generate large datasets, such as healthcare, education, and retail.
- Collecting lots of data – from websites, from social media – is easy enough; “the question is what you do with it,” Anand says. “That’s where the power of data science comes in.”
- Data can be “structured” or “unstructured.” Structured data usually consists of numbers or categories that are neatly formatted and easily accessible. Unstructured data, which is increasing in importance, is “messier” and loosely organized, such as the text, pictures, videos, and music on social media.
- 90 percent of data, it is estimated, will be “unstructured” in three to five years.
- Data science is useful only if it can lead to actionable information.
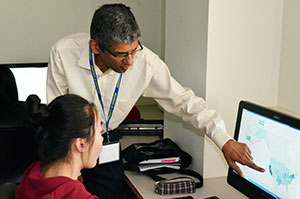
Ajay Anand shares some tips on using Tableau for data
visualization with Yihong Li, a rising senior from Shanghai.
So, while data is important, the real power of data science “comes from the science.”